The objective of this tutorial is to
learn how to use the MMTSB Tool Set for carrying out and analyzing DNA simulations with CHARMM. Specifically we will simulate the sequence d(CCCCCCTTTTTT)2.
|
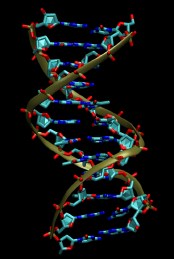
In this tutorial the B-DNA dodecamer d(CGCGAATTCGCG)2 is used as starting point. A crystal structure
is available from the Protein Data Bank
with the PDB code
1BNA. A picture is shown below.
|
1. Initial Structure
Begin by downloading/copying the PDB file (1BNA). Extract the two nucleic acid strands with:
convpdb.pl -nsel nucleic 1BNA.pdb > 1bna.dna.pdb
Since we want to simulate d(CCCCCCTTTTTT)2 for which a structure is not available we will mutate the nucleotides in the 1BNA structure:
mutateNA.pl -seq A1:B12:CCCCCCTTTTTT 1bna.dna.pdb > ct.dna.pdb
This commmand expects the first base on the first strand (A1) as well as the first complementary base on the second strand (B12) followed by the new sequence (CCCCCCTTTTTT) as parameters.
2. Energy Minimization
We begin with an energy minimization in
distance dependent dielectric to approximate solvent:
    minCHARMM.pl -par dielec=rdie,epsilon=4,minsteps=50 \
                 -log min.log ct.dna.pdb > ct.min.pdb
This script will carry out steepest descent minimization first and then a more effective
minimization method (Adopted-Basis Newton-Raphson) over 50 steps.
Check the CHARMM log file min.log and look at the minimized structure with VMD
to make sure everything is ok.
3. Explicit Solvent Simulation
Next, we will setup the simulation box for an explicit solvent simulation.
First, we need to solvate the DNA in a box of water. We will use a rectangular box to match the
dimensions of DNA better:
convpdb.pl -solvate -cutoff 9 ct.min.pdb > ct.solvated.pdb
Write down the box dimensions that were reported.
Second, we will add counterions to balance the charge of the DNA. Each phosphate has a charge of -1, but
no phosphate group is present with the default termini for the 5' nucleotide of each strand. Therefore,
the total charge is -22. You can check with the following command:
enerCHARMM.pl -charge ct.min.pdb
Counterions (we will use sodium) are added with the following command:
convpdb.pl -ions SOD:22 ct.solvated.pdb > ct.water.ions.pdb
We now have a complete initial system from which we can start a simulation. Begin by minimizing
the entire system. Replace the box dimensions obtained earlier in the following command:
    minCHARMM.pl -par minsteps=50,boxx=xxx,boxy=yyy,boxz=zzz \
                  ct.water.ions.pdb > ct.water.ions.min.pdb
Check the resulting system again with VMD before beginning the molecular dynamics simulations.
In order to equilibrate the DNA system we will need to slowly heat the system with the following series
of commands. Again, replace the correct box dimensions of the system:
    mdCHARMM.pl -par dynsteps=500,boxx=xxx,boxy=yyy,boxz=zzz,dyntemp=100 \
                -final ct.md1.pdb ct.water.ions.min.pdb
    mdCHARMM.pl -par dynsteps=500,boxx=xxx,boxy=yyy,boxz=zzz,dyntemp=200 \
                -final ct.md2.pdb ct.md1.pdb
    mdCHARMM.pl -par dynsteps=500,boxx=xxx,boxy=yyy,boxz=zzz,dyntemp=250 \
                -final ct.md3.pdb ct.md2.pdb
    mdCHARMM.pl -par dynsteps=500,boxx=xxx,boxy=yyy,boxz=zzz,dyntemp=300 \
                -final ct.md4.pdb ct.md3.pdb
If everything went well so far we are now ready to run a short "production" simulation. This step may take about an hour to complete:
    mdCHARMM.pl -par dynsteps=5000,boxx=xxx,boxy=yyy,boxz=zzz \
                -par dyntemp=300,dynoutfrq=10 -trajout ct.md5.dcd \
                -log ct.md5.log -final ct.md5.pdb ct.md4.pdb
4. Analysis
We can analyze the trajectory with
analyzeCHARMM.pl.
First, it is interesting to examine the value of the sugar pucker,
a key characteristic of A- vs. B-DNA. The following command will calculate
the pucker for all of the nucleotides in the first strand (chain A):
analyzeCHARMM.pl -sel A: -pucker -pdb ct.md4.pdb ct.md4.dcd
You will find that the output actually contains 12 pairs of values per time step. The
first value is the phase (100-180 means B-form, 0-40 means A-form), the second value
is the amplitude.
Did any of the sugar puckers leave the B-form from the intial crystal structure?
Second, the width of the minor groove can be monitored from the C1'-C1' distance of
complementary bases on opposite strands. For example, the distance between the C1' of THY7 (first strand) and C1' of ADE6 (second strand) would measure the minor groove width at the center of the helix. The following
command can be used to obtain a time series of this distance (the back quotes are needed
to mask the prime character from the shell).
analyzeCHARMM.pl -dist -dsel A:7.C1\' B:6.C1\' -pdb ct.md4.pdb ct.md4.dcd
How do these values compare with the minor groove near either one of the termini?